Delta Think on Open Access Books
What's Happening Here?
Dan Pollock of Delta Think recently examined how the growth of the Directory of Open Access Books (DOAB) has developed over the last 18 months, looking at some key statistics from the Directory and examine the continuing growth in OA Books. What appears below is an excerpt from the News and Views article, dated February 14.
Background
The Directory of Open Access Books (DOAB) tracks academic books, which “must be made available under an open access licence and be subjected to independent and external peer review prior to publication”. It is a useful proxy for how the OA books market is developing.
We have previously analyzed how it was growing and its composition. Around 18 months later, we update our analysis to see how things have changed.
Growth of the DOAB
Figure 1: DOAB Cumulative #titles and #publishers by year of submission
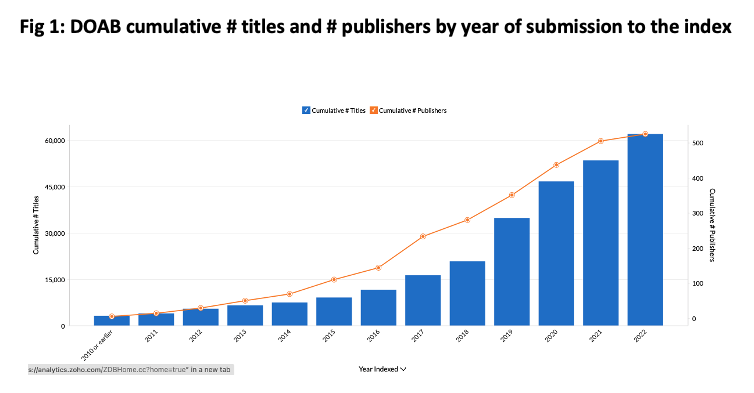
The DOAB now claims to have well over 60,000 titles, and continues to grow. The chart below shows how the index has grown.
The chart above shows the cumulative number of titles and publishers growing over time.
- The number of titles has doubled since our last analysis, to just over 60,000 from around 500 publishers.
- There was a 17% year-on-year growth in the number of titles from 2021 to 2022.
- The rate of growth is slowing: The 5-year CAGR from 2017-2022 is around 36%.
- There are now 525 publishers registered in the index, up from around 490 at the time of our last analysis.
- As with the number of indexed titles, the number of publishers continues to grow, but at a slowing rate.
- Our previous analysis excluded titles with an unspecified Indexed year. Our current analysis includes all titles, using their publication year as a proxy for their indexed year if the latter is not specified.
Leading publishers using the DOAB
Fig 2 - DOAB cumulative # titles by top 10 publishers by year of submission
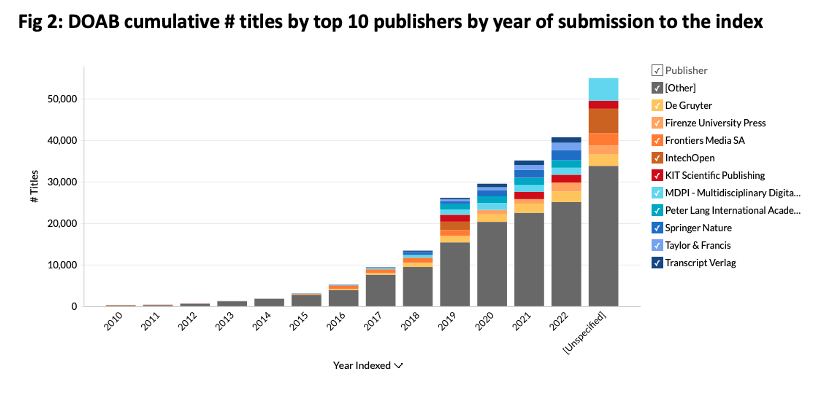
The chart below analyses the larger contributors of data to the DOAB.
The figure above shows the cumulative number of titles added to the index over time by the top 10 publishers.
- The books market is consolidated: The top 10 publishers account for around 48% of total output.
- Consolidation has been increasing, with the top publishers taking increasing share over time. From 2018, the few larger publishers have increasingly started to dominate.
- Around 16% of the records do not specify when the book was added to the index. (These are shown in the right-most column.) This speaks to some issue either with publishers’ deposition of metadata or the indexing itself. A subset of the larger publishers covers a disproportionally large share of these unknown years.
Full Text of Analysis Available
Please visit the Delta Think site to read their analysis of OA book activity in full.